
第4回 Amazon Linux2023 で minecraft を遊ぶ – CloudWatch Logs 編

本シリーズの目標
何かしらの手段でインスタンスを起動させ、minecraft を遊べるようにする。
minecraft は mod の導入が可能な forge サーバーにする。
ログインしている人がいなくなったら、自動的にインスタンスを停止させる。
最終的には、AMI 化してインスタンスを終了することで、課金額を抑える。
今回の目標
ここからは、少しだけ難しいことをやっていく必要があります。
今回は下準備として、Minecraft のログを、CloudWatch Logs で確認出来るようにします。
ゲームが起動した情報や、ゲームに誰かがログインしたという情報、ゲームから誰かがログアウトしたという情報を効率的に収集し、ゲームが起動したことを通知する、とか、ゲームから誰もいなくなったからインスタンスを停止する、とか、インスタンスの運用を自動化していくための下準備となります。
今回の対象者
前回記事を参考に、起動停止の設定が出来ている方が対象となります。
そんなに難しくはありませんので、是非、挑戦してみてください!
はじめに
猫とキャンプと野球観戦と AWS が大好きな旦那、LeoSaki です。モフモフしたい。
ここからは、どうしても多少面倒な手順を実施する必要があります。本業なので、LeoSaki(旦那)は好きな作業ですが。どうしてもわからないことが出てしまわれた方は、コメントください。基本的には書いてあることを書いてある通りに進めていけば出来るようになっているはず・・・。
ロールの設定
まずは、CloudWatch Logs へログを出力出来るように、EC2 インスタンスへ権限を与えてあげる必要があります。
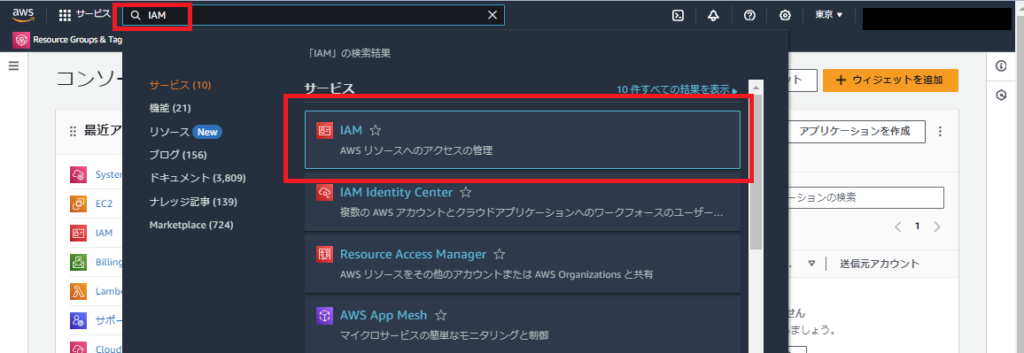
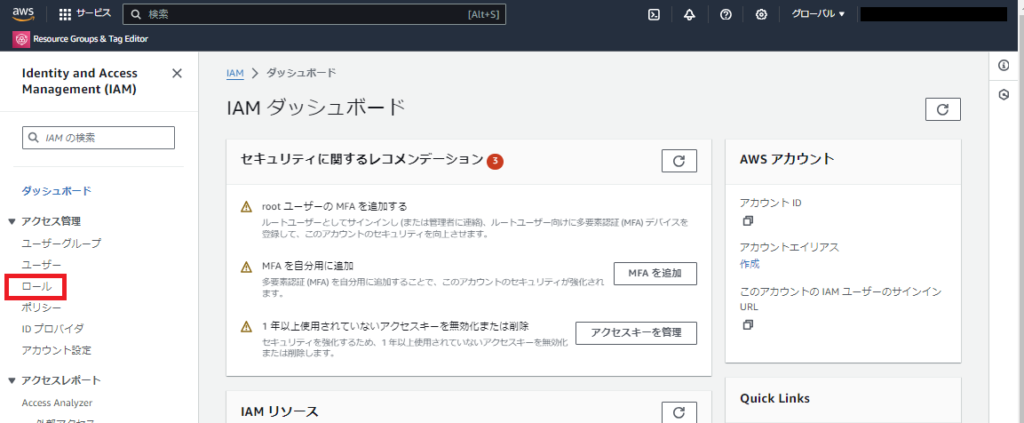
IAM のコンソール画面を開きます
左の柱から「ロール」を選択します
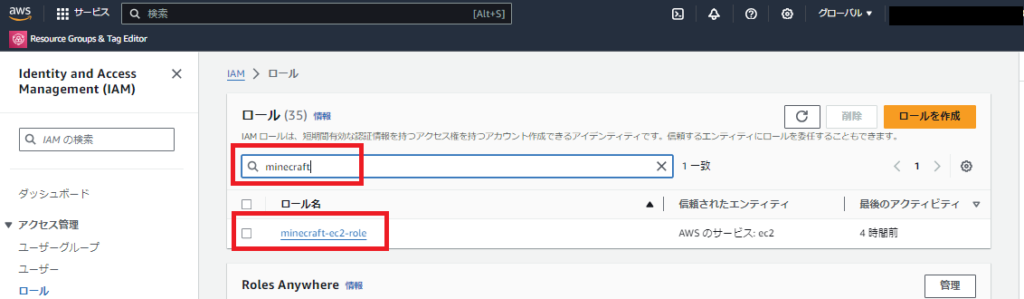
現在 EC2 インスタンスにアタッチしているロールを選択してください
第 1 回で EC2 インスタンスを作成した際に作ったロール名は「minecraft-ec2-role」でした
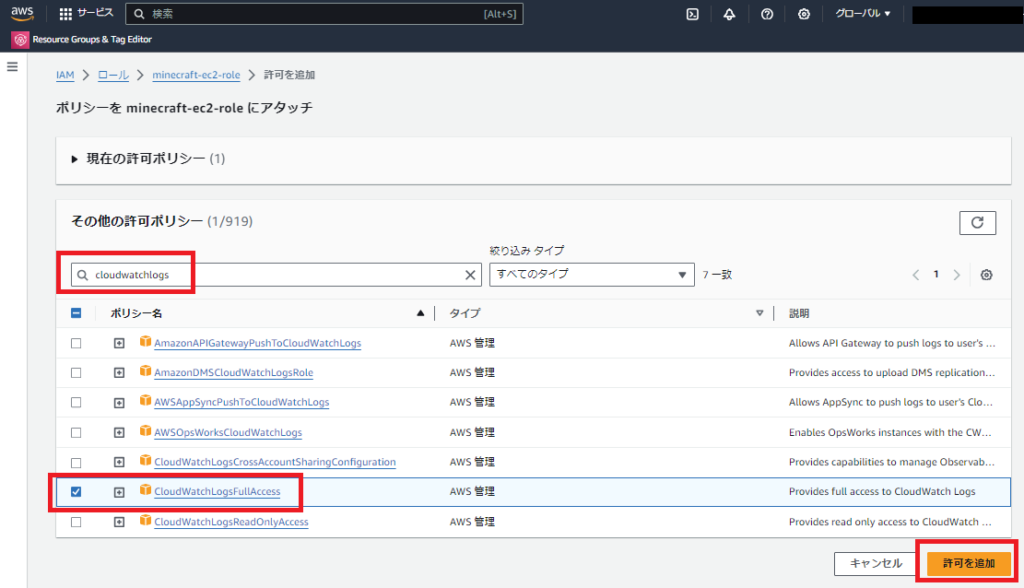
「許可を追加」から「ポリシーをアタッチ」を選択します
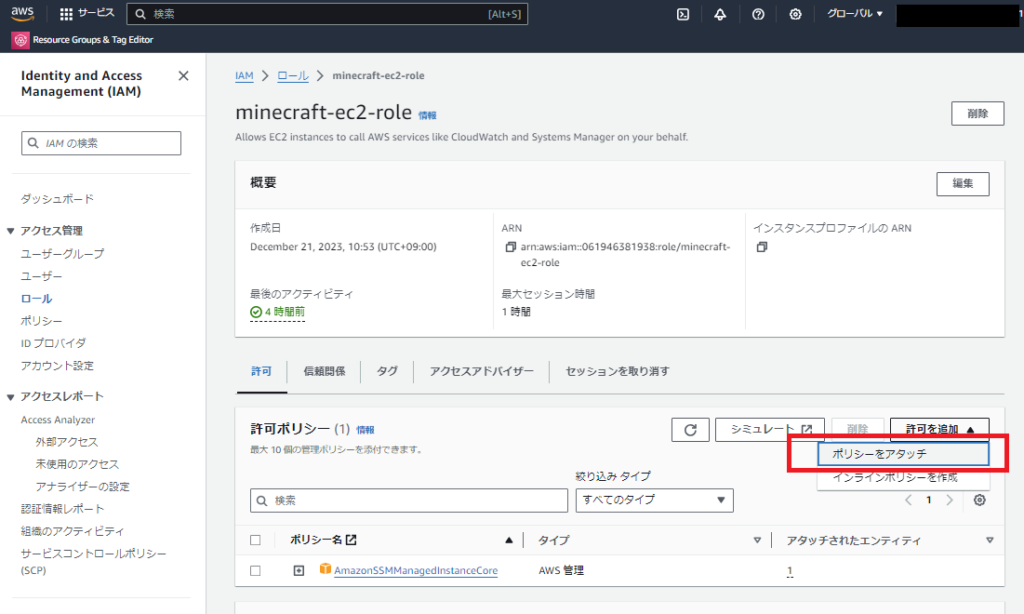
今回は「CloudWatchLogsFullAccess」を選択しました
選択したら、右下の「許可を追加」を押します
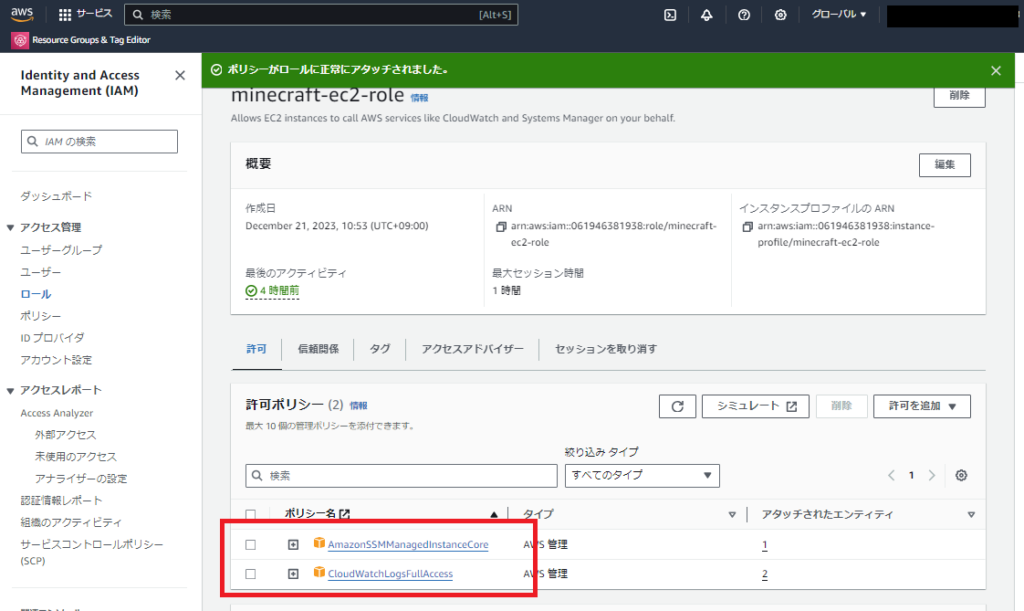
ポリシーがアタッチされていることが確認出来れば成功です
CloudWatch エージェントのインストールと設定
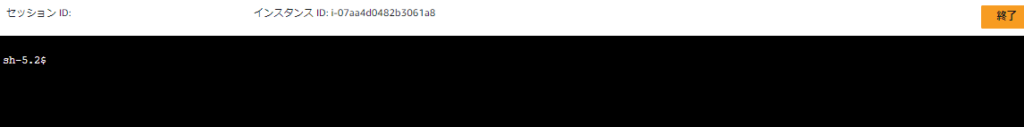
セッションマネージャーで、インスタンスに接続します。
これまでの記事で何度か書いていますので、接続の方法は割愛。
以下のコマンドを入力します
collectd のインストール
$ sudo dnf install collectd -ycloudwatch-agent のインストール
$ sudo dnf install amazon-cloudwatch-agent -yディレクトリを移動して、対話式の wizard を開始します
$ cd /opt/aws/amazon-cloudwatch-agent/bin
$ sudo ./amazon-cloudwatch-agent-config-wizard
以下の通りに設定をすすめてください
色が変わっているところが、入力しなければいけないところです。それ以外は Enter キーで進めます
$ sudo ./amazon-cloudwatch-agent-config-wizard
================================================================
= Welcome to the Amazon CloudWatch Agent Configuration Manager =
=                                                              =
= CloudWatch Agent allows you to collect metrics and logs from =
= your host and send them to CloudWatch. Additional CloudWatch =
= charges may apply.                                           =
================================================================
On which OS are you planning to use the agent?
1. linux
2. windows
3. darwin
default choice: [1]:

Trying to fetch the default region based on ec2 metadata...
2023/12/25 17:43:28 I! imds retry client will retry 1 times
Are you using EC2 or On-Premises hosts?
1. EC2
2. On-Premises
default choice: [1]:

Which user are you planning to run the agent?
1. root
2. cwagent
3. others
default choice: [1]:

Do you want to turn on StatsD daemon?
1. yes
2. no
default choice: [1]:
2
Do you want to monitor metrics from CollectD? WARNING: CollectD must be installed or the Agent will fail to start
1. yes
2. no
default choice: [1]:
2
Do you want to monitor any host metrics? e.g. CPU, memory, etc.
1. yes
2. no
default choice: [1]:

Do you want to monitor cpu metrics per core?
1. yes
2. no
default choice: [1]:
2
Do you want to add ec2 dimensions (ImageId, InstanceId, InstanceType, AutoScalingGroupName) into all of your metrics if the info is available?
1. yes
2. no
default choice: [1]:

Do you want to aggregate ec2 dimensions (InstanceId)?
1. yes
2. no
default choice: [1]:

Would you like to collect your metrics at high resolution (sub-minute resolution)? This enables sub-minute resolution for all metrics, but you can customize for specific metrics in the output json file.
1. 1s
2. 10s
3. 30s
4. 60s
default choice: [4]:

Which default metrics config do you want?
1. Basic
2. Standard
3. Advanced
4. None
default choice: [1]:
2
Current config as follows:
{
        "agent": {
                "metrics_collection_interval": 60,
                "run_as_user": "root"
        },
        "metrics": {
                "aggregation_dimensions": [
                        [
                                "InstanceId"
                        ]
                ],
                "append_dimensions": {
                        "AutoScalingGroupName": "${aws:AutoScalingGroupName}",
                        "ImageId": "${aws:ImageId}",
                        "InstanceId": "${aws:InstanceId}",
                        "InstanceType": "${aws:InstanceType}"
                },
                "metrics_collected": {
                        "cpu": {
                                "measurement": [
                                        "cpu_usage_idle",
                                        "cpu_usage_iowait",
                                        "cpu_usage_user",
                                        "cpu_usage_system"
                                ],
                                "metrics_collection_interval": 60,
                                "totalcpu": false
                        },
                        "disk": {
                                "measurement": [
                                        "used_percent",
                                        "inodes_free"
                                ],
                                "metrics_collection_interval": 60,
                                "resources": [
                                        "*"
                                ]
                        },
                        "diskio": {
                                "measurement": [
                                        "io_time"
                                ],
                                "metrics_collection_interval": 60,
                                "resources": [
                                        "*"
                                ]
                        },
                        "mem": {
                                "measurement": [
                                        "mem_used_percent"
                                ],
                                "metrics_collection_interval": 60
                        },
                        "swap": {
                                "measurement": [
                                        "swap_used_percent"
                                ],
                                "metrics_collection_interval": 60
                        }
                }
        }
}
Are you satisfied with the above config? Note: it can be manually customized after the wizard completes to add additional items.
1. yes
2. no
default choice: [1]:

Do you have any existing CloudWatch Log Agent (http://docs.aws.amazon.com/AmazonCloudWatch/latest/logs/AgentReference.html) configuration file to import for migration?
1. yes
2. no
default choice: [2]:

Do you want to monitor any log files?
1. yes
2. no
default choice: [1]:

Log file path:
/home/ssm-user/minecraft/logs/latest.log
Log group name:
default choice: [latest.log]

Log stream name:
default choice: [{instance_id}]

Log Group Retention in days
1. -1
2. 1
3. 3
4. 5
5. 7
6. 14
7. 30
8. 60
9. 90
10. 120
11. 150
12. 180
13. 365
14. 400
15. 545
16. 731
17. 1096
18. 1827
19. 2192
20. 2557
21. 2922
22. 3288
23. 3653
default choice: [1]:

Do you want to specify any additional log files to monitor?
1. yes
2. no
default choice: [1]:
2
Do you want the CloudWatch agent to also retrieve X-ray traces?
1. yes
2. no
default choice: [1]:
2
Existing config JSON identified and copied to:  /opt/aws/amazon-cloudwatch-agent/etc/backup-configs
Saved config file to /opt/aws/amazon-cloudwatch-agent/bin/config.json successfully.
Current config as follows:
{
        "agent": {
                "metrics_collection_interval": 60,
                "run_as_user": "root"
        },
        "logs": {
                "logs_collected": {
                        "files": {
                                "collect_list": [
                                        {
                                                "file_path": "/home/ssm-user/minecraft/logs/latest.log",
                                                "log_group_name": "latest.log",
                                                "log_stream_name": "{instance_id}",
                                                "retention_in_days": -1
                                        }
                                ]
                        }
                }
        },
        "metrics": {
                "aggregation_dimensions": [
                        [
                                "InstanceId"
                        ]
                ],
                "append_dimensions": {
                        "AutoScalingGroupName": "${aws:AutoScalingGroupName}",
                        "ImageId": "${aws:ImageId}",
                        "InstanceId": "${aws:InstanceId}",
                        "InstanceType": "${aws:InstanceType}"
                },
                "metrics_collected": {
                        "cpu": {
                                "measurement": [
                                        "cpu_usage_idle",
                                        "cpu_usage_iowait",
                                        "cpu_usage_user",
                                        "cpu_usage_system"
                                ],
                                "metrics_collection_interval": 60,
                                "totalcpu": false
                        },
                        "disk": {
                                "measurement": [
                                        "used_percent",
                                        "inodes_free"
                                ],
                                "metrics_collection_interval": 60,
                                "resources": [
                                        "*"
                                ]
                        },
                        "diskio": {
                                "measurement": [
                                        "io_time"
                                ],
                                "metrics_collection_interval": 60,
                                "resources": [
                                        "*"
                                ]
                        },
                        "mem": {
                                "measurement": [
                                        "mem_used_percent"
                                ],
                                "metrics_collection_interval": 60
                        },
                        "swap": {
                                "measurement": [
                                        "swap_used_percent"
                                ],
                                "metrics_collection_interval": 60
                        }
                }
        }
}
Please check the above content of the config.
The config file is also located at /opt/aws/amazon-cloudwatch-agent/bin/config.json.
Edit it manually if needed.
Do you want to store the config in the SSM parameter store?
1. yes
2. no
default choice: [1]:
2
Program exits now.
作成された config を所定の位置にコピーします
$ sudo cp -p config.json ../etc/ディレクトリを移動して、config を所定の名前に変更します
$ cd ../etc/
$ sudo mv config.json ./amazon-cloudwatch-agent.json
エージェントを restart します
$ sudo systemctl restart amazon-cloudwatch-agentインスタンスを再起動させても自動でエージェントが起動させるようにします
$ sudo systemctl enable amazon-cloudwatch-agent設定の確認
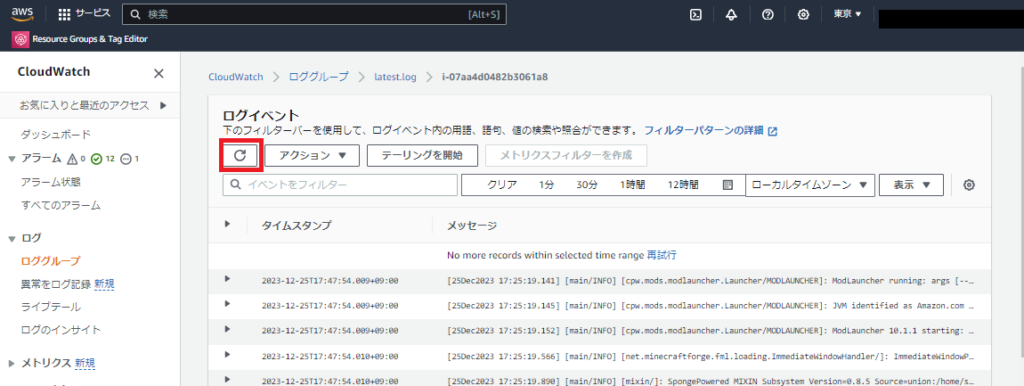
きちんとログが CloudWatch Logs で確認出来ることを確認します。
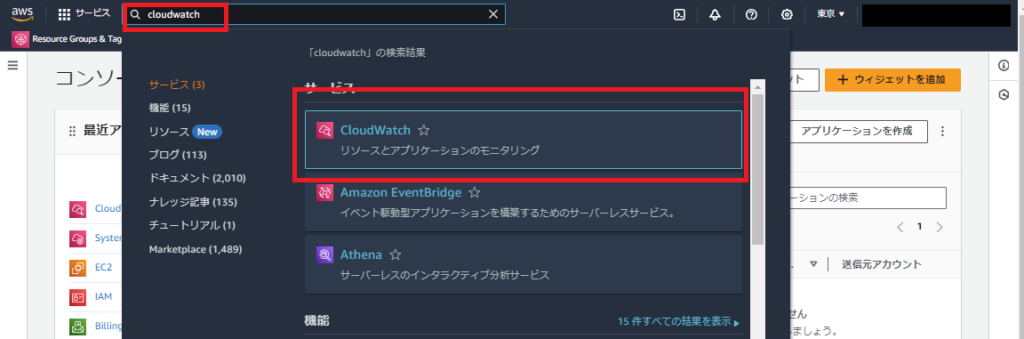
CloudWatch のコンソール画面を開きます
左の柱から「ロググループ」を選択します
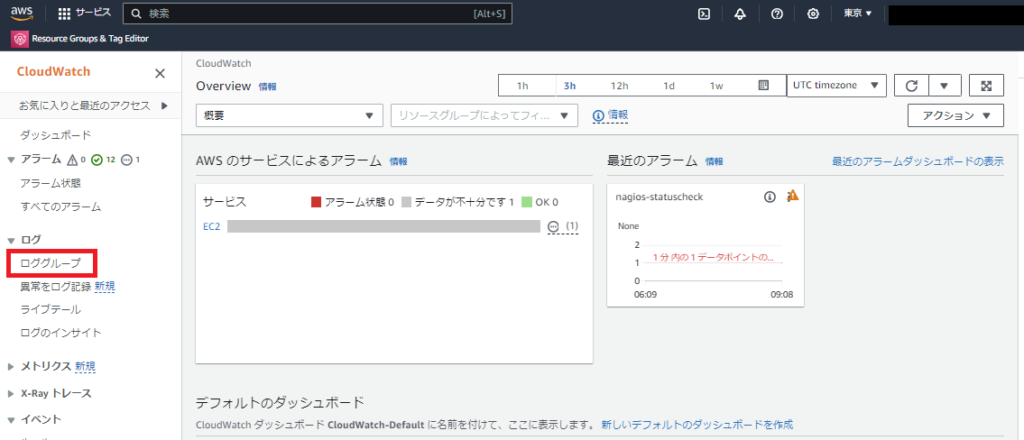
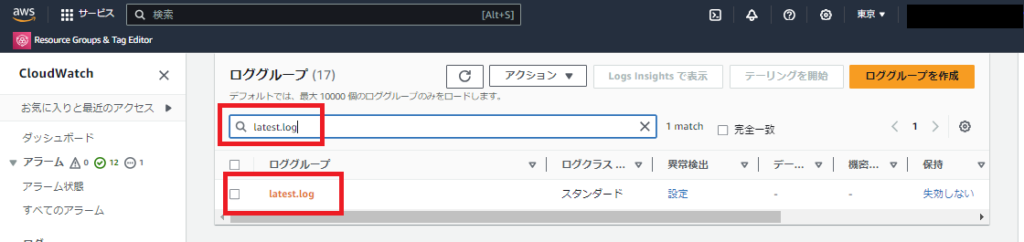
wizard で指定したロググループ名称でロググループが作成されてれば成功です
今回は、「latest.log」というロググループ名称で作成しています
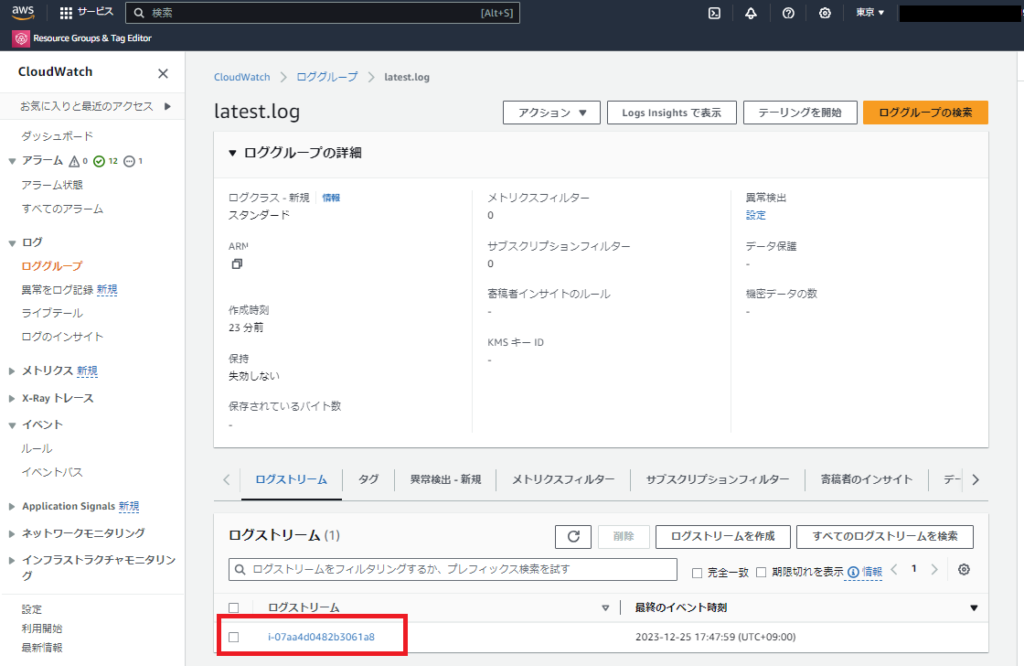
ログが登録されていることが確認できました
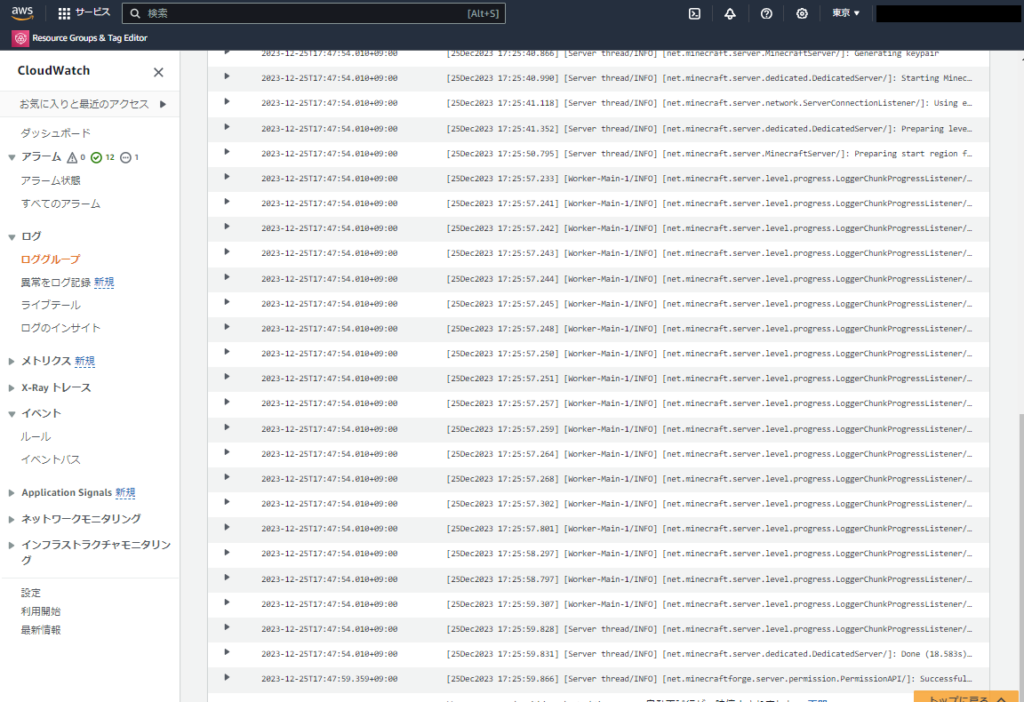
試しに、マイクラにログインしてみます
ログが更新されるか確認してみます
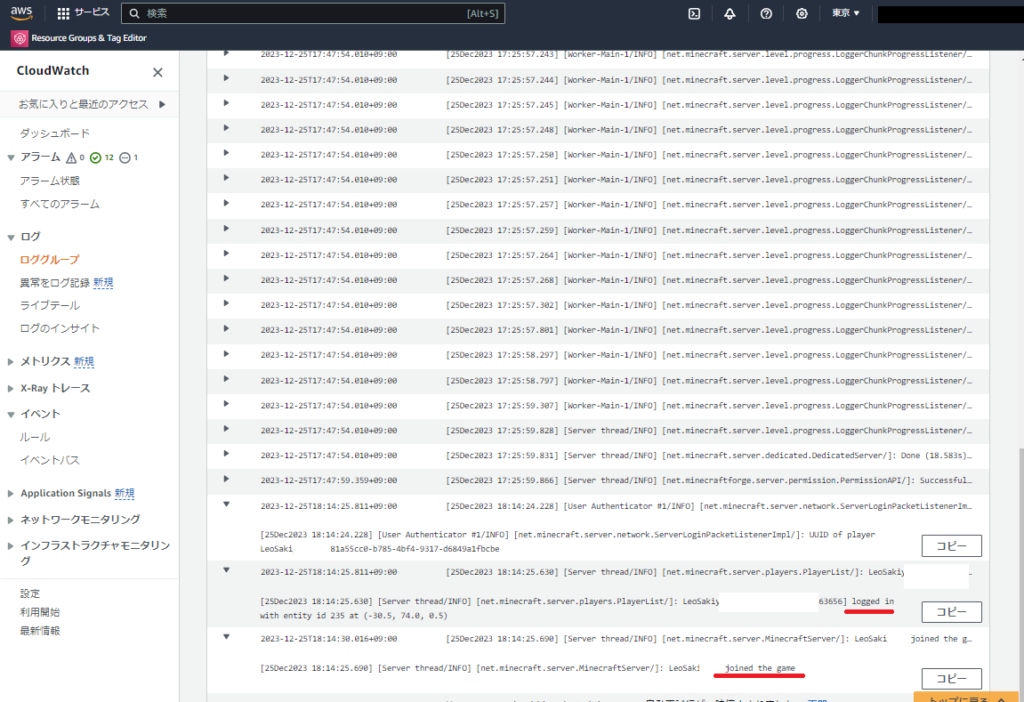
LeoSaki というユーザー(私)が、logged in し、joined the game したことが確認出来ました!
ゲームからログアウトしたら・・・
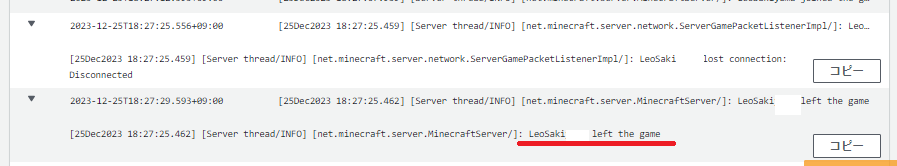
LeoSaki というユーザー(私)が、left the game したことが確認出来ました!
最後に
これで、CloudWatch Logs を確認すれば、誰がいつログインしたか、ログアウトしたかが分かるようになりました。
インスタンスへ接続せずとも、Minecraft で遊んだり、ゲーム内の状況を確認することが出来たり、徐々に管理がしやすくなっていってないでしょうか。
次からは、インスタンスの起動、停止を、AWS マネジメントコンソールへ接続せずに実行出来る方法について考えてみたいと思います。
Slack を利用する予定です。
引き続き、よろしくお願いします。